
Analytics is the key to the growth of any business. In MVP Project service you will find powerful reports that allow you to analyze in detail the sales funnel, customer behavior and team performance. In this article, we will look at all available types of reports – from deals to shifts – and tell you how to use them to make management decisions.
1. transaction report
Goal: Understand how many customers and sales you get from different sources.
Groupings:
– by date,
– by responsible manager,
– by channel (e.g. messenger, landing page, advertisement).
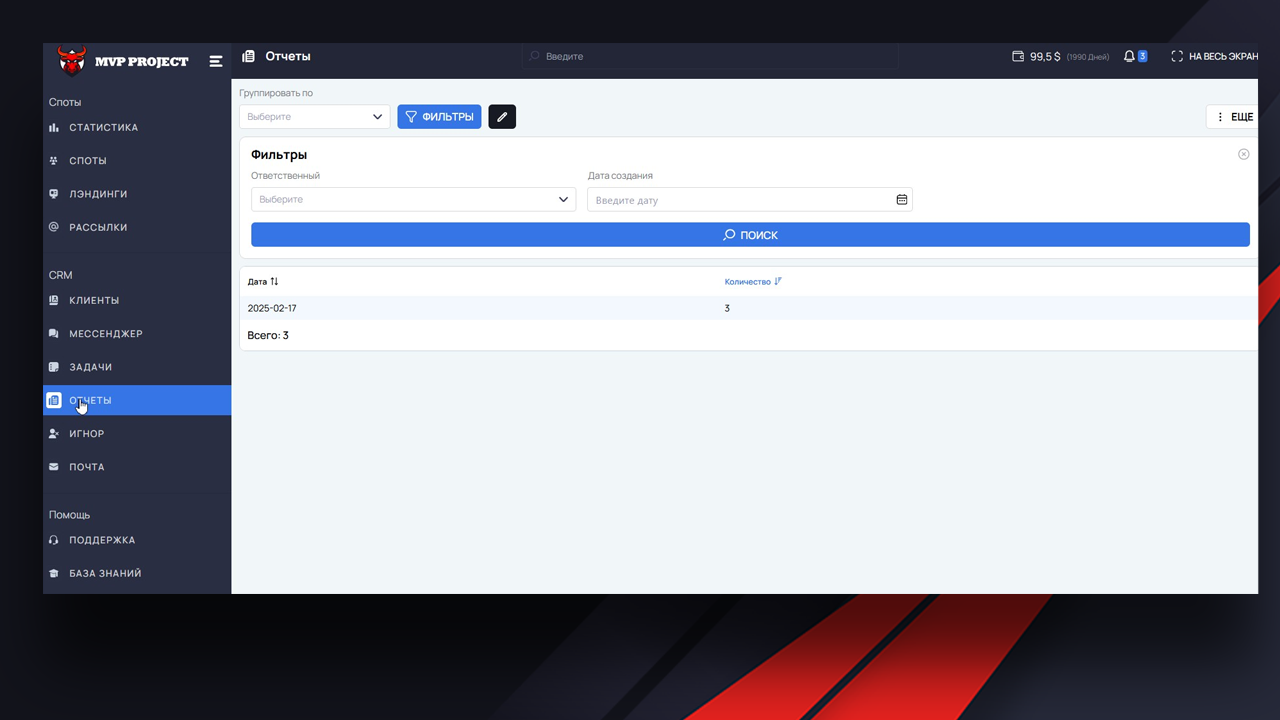
Columns:
– Name of channel / campaign / manager / date (depends on the selected grouping),
– Number of transactions.
Filters:
– Responsible,
– Date the transaction was created.
When useful: to evaluate the effectiveness of channels, days or specific managers. If you want to understand who or what brings the most leads, this is your basic tool.
2. conversion report
Purpose: Analyze how requests (leads) turn into sales.
Columns:
– Number of transactions,
– Number of sales,
– Sales amount,
– Conversion (%) – the ratio of sales to transactions.
Use for evaluation:
– Overall performance,
– Source impact on client motivation,
– Campaigns that actually work (or not).
When useful: when you need to understand at what stage of the funnel customers are lost and which channels bring not just leads, but real sales.
3. average check report
Purpose: To assess the depth of customer monetization.
Columns:
– Number of transactions,
– Number of sales,
– Sales amount,
– FD/RD – repeat sales rate,
– Average check = Sales amount / Number of sales.
Use for:
– Comparing the quality of leads and traffic,
– Analyzing different advertising campaigns by profitability,
– Studying customer behavior.
When useful: when it’s important to understand how “expensive” your customers are and what sources yield a paying audience.
4. shift report
Purpose: To manage and supervise shift managers.
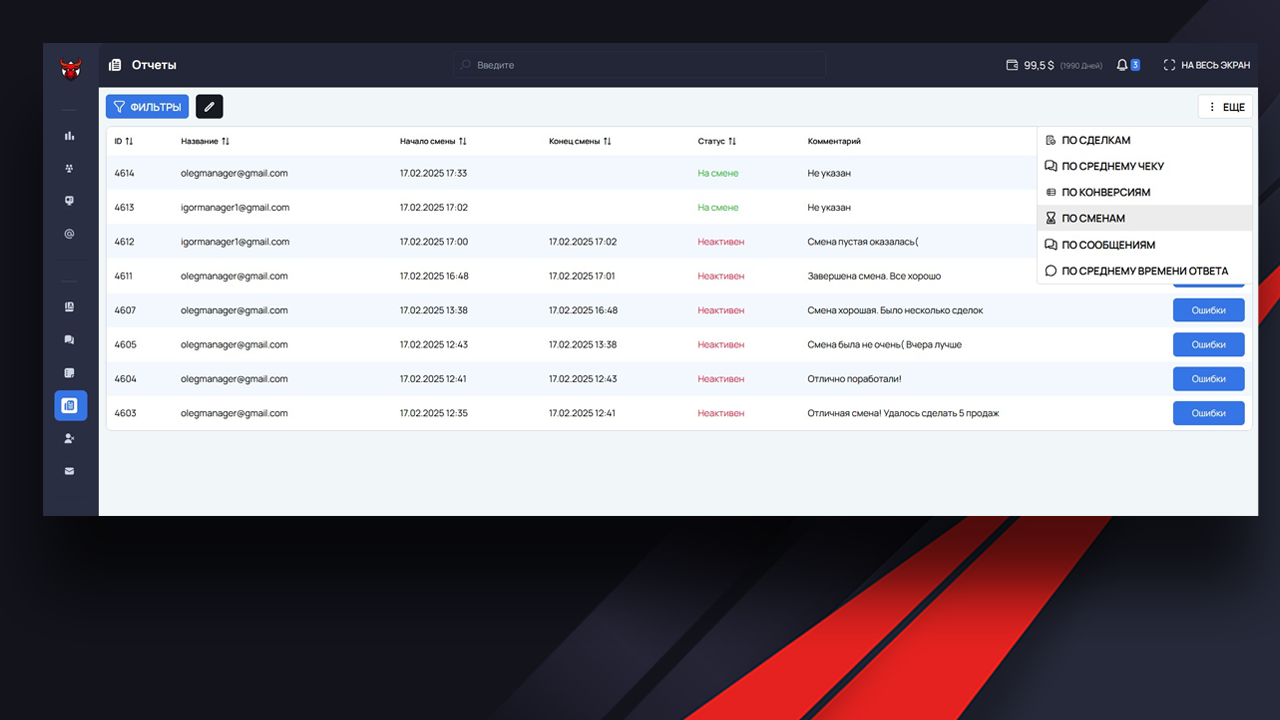
Columns:
– Shift ID,
– Manager’s Name and Email,
– Shift Start and End Time,
– Status (active / completed),
– Shift Comments,
– Errors button – go to detailed report on messages.
Used for:
– Controlling employee activity,
– Accounting of working hours,
– Assessing the quality of communication with customers.
When useful: for managers who want to see the real picture – who worked, when, and how effectively.
5. Report on average response time
Purpose: To assess the speed of managers’ response to customer requests.
Metric: Average time from message arrival to first response.
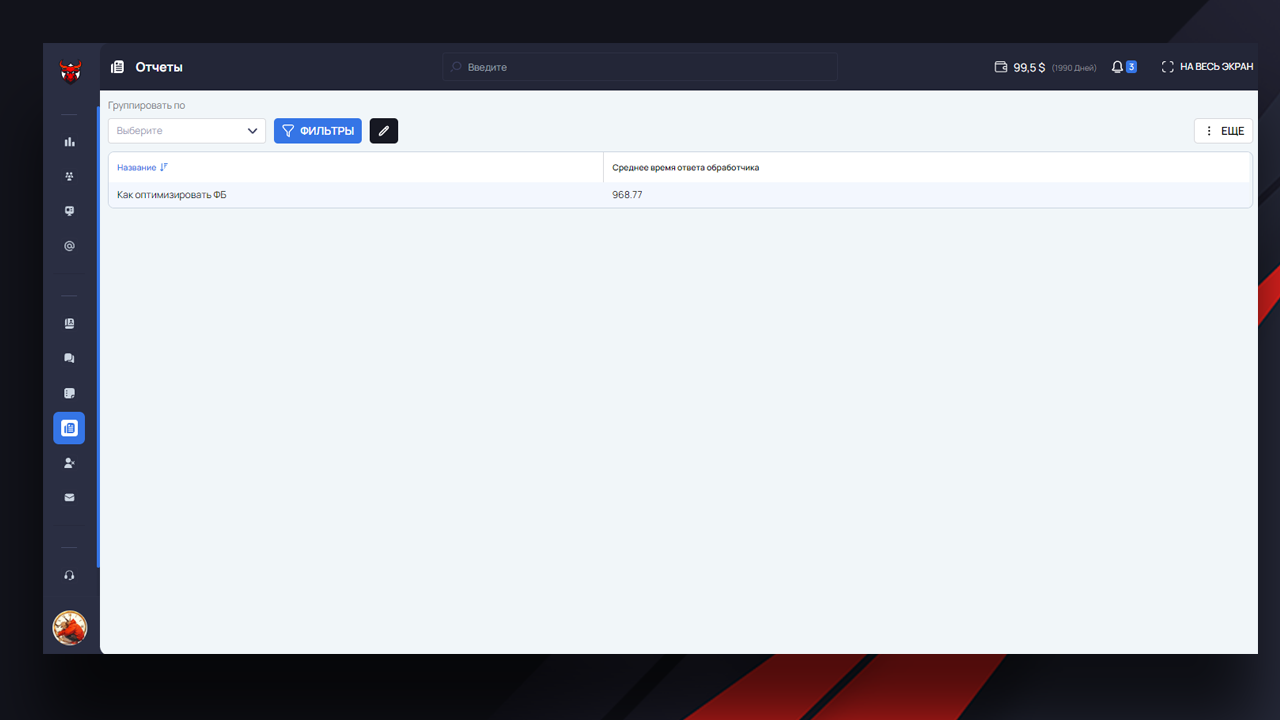
When useful:
If customer service is your priority. Slow responses can cost you deals. This report helps you find bottlenecks and speed up communication.
6. Report on communications
Purpose: To analyze the quality and quantity of correspondence with customers.
Opportunities:
– Reviewing the content of dialogs,
– Estimating the number of messages per shift,
– Analyzing errors and patterns in communication.
When useful: for detailed assessment of how managers conduct dialog. It is also used for training and adjusting scripts.
Conclusion
Reports in MVP Project are not just tables, but real management tools. They allow you to:
– monitor team effectiveness,
– understand the weaknesses and strengths of the funnel,
– improve customer experience and increase sales.
We recommend using at least 3-4 reports from the list on a regular basis to keep your finger on the pulse of your business and react quickly to changes.


No Comment! Be the first one.